First, I would like to thank for you for downloading First Alert Service Monitor by
ElectraSoft. The people here work hard to bring you powerful, quality
software. If you need technical assistance, ordering information, or any
other information, please call us at 1-281-499-8246 or email us.
You can try First Alert Service Monitor for free before you buy it. When you are done trying
out the software, you can either register (purchase) it, or un-install it.
If you get a window popping up asking you to register, and you are not
done testing the software, just click on [Get Registration Code from
ElectraSoft Later].
Getting Started:
For any help with the interface or to see what any features do, please
Click on [Help], [Help] from the First Alert Service Monitor top menu items,
shown below:
Once you have started First Alert Service Monitor, click on the menu item, [Tools], [Global Options], as shown below.
This will bring you here:
Once here, you can configure any options you see to your liking. Click on the [Apply] or [Cancel] button to leave the Global Options.
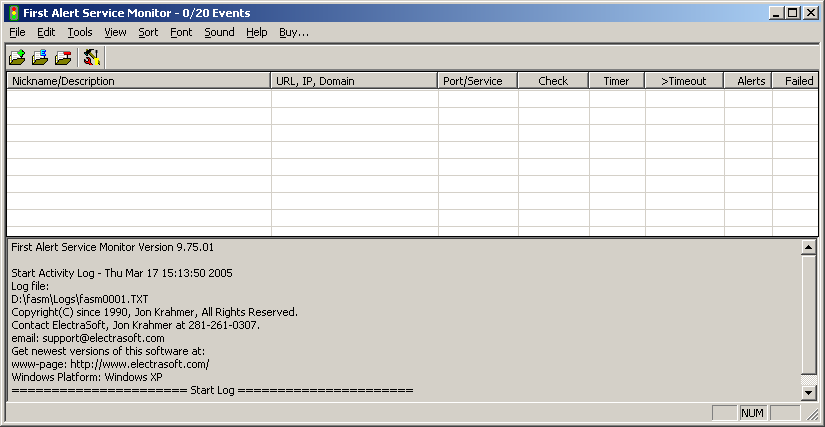
Once you close the Global Options, you should be at the main screen. If you haven't added anything to monitor yet, then First Alert Service Monitor should look something like this:
Adding Services to Monitor
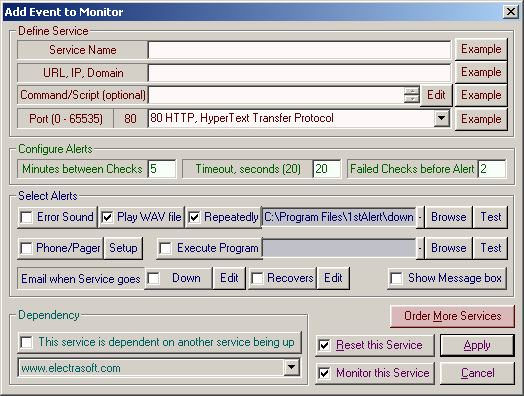
Click on the menu item, [Edit], [Add Event to Monitor]. (Show below)
That will bring up this box:
For the [Service Name] text box, enter a name that you will refer
to this new service being monitored. For instance, if your web site
address were http://www.mygreatsite.com and you wanted to monitor the web
site to know if it stops responding, you may use the service name,
"MyGreatSite - HTTP". Because that is the name of the site, and the
protocol you will be monitoring with this event. The name has no effect on
how the service is checked.
For the [URL, IP, Domain] text box, enter in the actual address of
the service you will be monitoring. For instance, if your web site address
were http://www.mygreatsite.com - then you would enter in
www.mygreatsite.com in this box. Leave off the "http://" as that is
denoting the protocol it is, and is not needed for the purposes of this
program. You can enter in an alpha-numeric (domain name) address or an IP
address (if you know it) here.
The [Command/Script] box is optional and we will not discuss this
here, as this is a tutorial to get you started using the program quickly.
Scripting is more advanced and can be read more in the help file. Also,
you can click on the [Example]
button next to this field for more information and example scripts.
For the [Port (0 - 65535)] option, you will need to select which
port/type of network service to monitor. For instance, if you are
monitoring a web site, select port [80 http]. The "http" denotes the
service protocol. In the ports list, many of the common ports are listed,
along with the type of service they are normally associated with.
Note: If you do choose port 80 for this option, First Alert
Service monitor will automatically put the "GET /" script up in the
[Command/Script] text box. This makes the WWW (HTTP) service checking
faster
[Minutes Between Checks] by default is set to 5 minutes. That
means that every 5 minutes, it will check to see if this service is
responding correctly. You can change this to more or less, as you see
fit. If you are unsure, just leave it at 5 minutes.
[Fields Checks Before Alert] by default is set to 2 times. That
means that if the service fails to respond correctly 2 time sin a row,
then the appropriate actions alerts (as configured just below this option)
will take place.
[Timeout, seconds (20)] by default is set to 20 seconds. That means
that each time this service is checked, the service has 20 seconds to
respond. A timeout is necessary because establishing a connection to a
network service is not always so instant. It is recommended that you leave
the timeout set to 20 seconds. Only change this option if you need to, for
your own reasons.
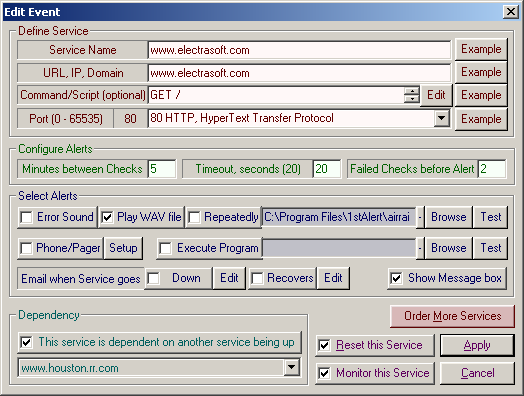
There are many options for alerting you when the service is not responding.
In this example below, I am monitoring ElectraSoft's web site. See the
options I have chosen here: (Note this is an example only, you should enter in your own web site,
not ElectraSoft's)
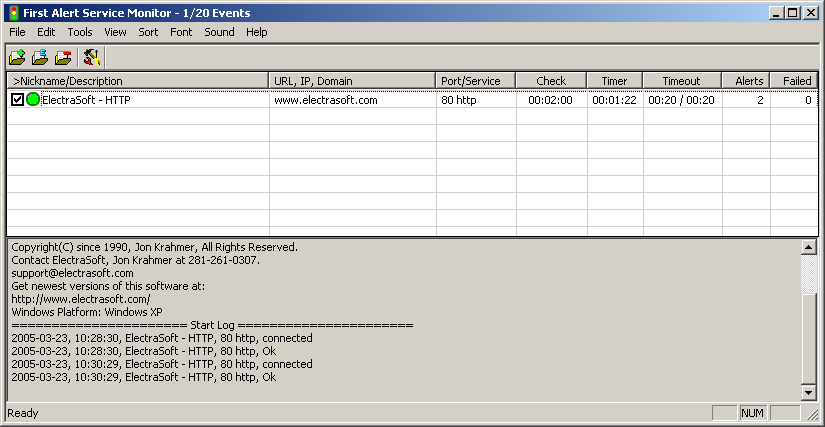
Once you have entered your own information and set the alerts you want,
click on the [Apply] button. Once you do that, you will be taken back to
the main screen with your service added to the list and being actively
monitored. See below:
Your service is now being monitored.
You can now edit the service by double clicking it. You can also add more
services to be monitored by doing the same thing you were just stepped
through doing.
This concludes the online tutorial. If you have more questions, please
read through the help files within First Alert Service Monitor. If your
question is still not answered, you can call ElectraSoft at 1-281-499-8246
or
email us.
If you have found this tutorial to be helpful, or not helpful, please
email us and tell us.
![[Help], [Help]](mu_h_h.png)
![Main Menu: [Tools], [Global Options]](mu_t_go.png)
![[Global Options]](options.png)
![Main Menu: [Edit], [Add Event to Monitor]](mu_e_add.png)